| Theoretische Chemie, Ruhr-Universität Bochum, Germany, www.theochem.ruhr-uni-bochum.de |
| Homepage of the Behler group |
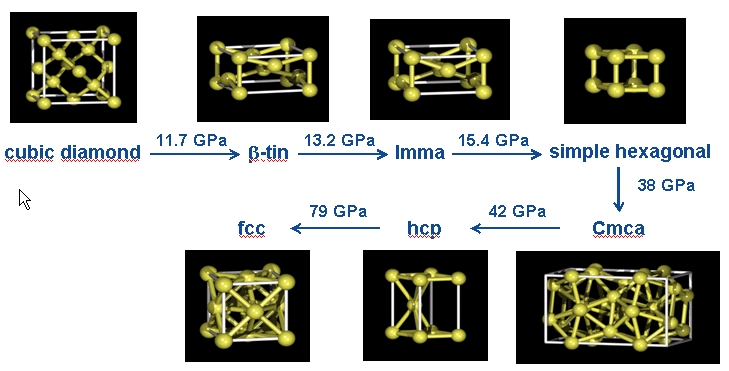
The high-pressure phase diagram of Silicon [1]
More illustrations of these crystal structures can be found
here.
However, many methods employed to generate candidate structures for stable phases, like extensive molecular dynamics (MD) simulations [3], genetic algorithms and many others, can be computationally very demanding if they are coupled directly with DFT because of the sheer number of atomic configurations emerging in the simulations. It is thus desirable to have an efficient potential, which is sufficiently fast to calculate the energies of all these structures, but which is at the same time also very accurate. Here, we employ a recently developed high-dimensional Neural Network potential [4], and couple this potential with the metadynamics scheme for crystal structure prediction [5,6]. With this combination of methods we have shown that it is possible to "walk" through the phase diagram in a sequence of simulations. These simulations are carried out at increasing pressures and start from the structure found to be stable in the previous simulation.
In the following sections the results of typical metadynamics simulations employing the Neural Network potential are discussed. Further details on the simulations can be found in Refs. [7,8].
The Neural Network potential has been constructed using DFT calculations with the PWSCF code [9] employing the local density approximation. In total about 20,000 bulk structures containing 64 silicon atoms have been calculated to set up the Neural Network potential. The root mean squared error (RMSE) is about 5-6 meV per atom, i.e., the numerical values of the DFT total energies are very accurately reproduced. However, the Neural Network can be evaluated about 30,000 times faster than the DFT energy for a 64 atoms system, and in general the Neural Network scales linearly with system size.
This allows to perform a large number of metadynamics simulations at various pressures, temperatures and with different initial structures, which would be prohibitively expensive with DFT. A typical metadynamics simulation (100 metasteps, each containing a 2 ps MD simulation) with the Neural Network potential takes about 2 days on a standard desktop PC (compared to about 100 CPU-years if DFT would be used directly).
In order to illustrate the accuracy of the Neural Network potential, we show here the energy vs. volume curves for several real and fictive crystal structures of silicon and compare the energies obtained with DFT and the Neural Network.
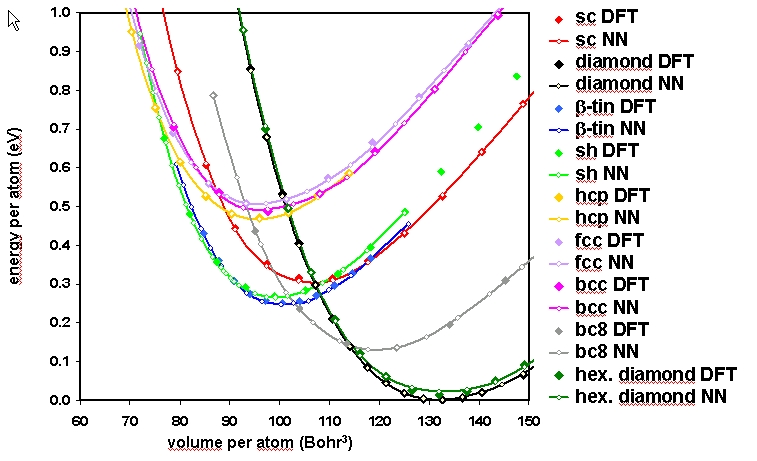
Comparison of the energy vs. volume curves for several crystal structures of silicon obtained with DFT and the Neural Network Potential
At ambient conditions the thermodynamically stable phase of silicon is the cubic diamond structure. Upon compression, experimentally at about 12 GPa a transition to the β-tin phase is found. We have studied this transition by a number of metadynamics simulations. A movie showing the final structure of each metastep is shown below. In order to analyze the obtained structures, we generally relax the atomic positions and the lattice vectors of the final structure of each metastep after the metadynamics simulation has ended. This yields discrete enthalpy levels for the different structures as can be seen below.
Initially, the cubic diamond structure is maintained, but in metastep 39 a strong increase in the enthalpy is observed. This increase is related to the formation of a second phase in the system. After a few more metasteps the transition is completed and the system adopts the Imma structure, which in turn quickly transforms to the thermodynamically stable β-tin phase. Please note that the β-tin, the Imma and the simple hexagonal phases have a very similar enthalpy, and in different simulations we found that each of these phases can be obtained as the first structure emerging from the transition. In all simulations, we finally obtain the β-tin structure as the most stable phase.
(click on image to start movie)
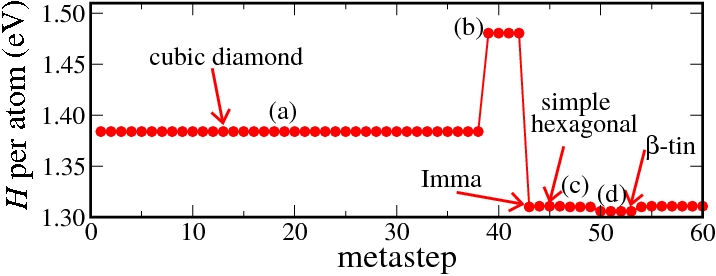
Enthalpy diagram of the cubic diamond to β-tin transition
The β-tin, the Imma, and the simple hexagonal phases are structurally and energetically very similar. Still, the Neural Network is able to resolve the fine energetic differences and to provide the correct enthalpic order. This is demonstrated by a metadynamics simulation at 16 GPa, in which we find frequent transitions between these phases. This is because the barriers (if any) for the transitions are extremely small, so that the metadynamics simulation corresponds more or less to a random walk. Please note the tiny enthalpy differences of only 1 meV between the phases.
(click on image to start movie)
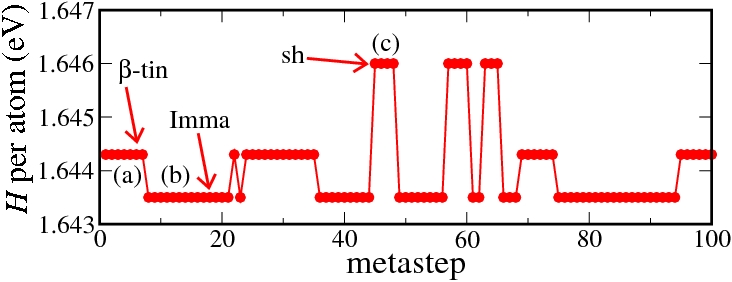
Enthalpy diagram of the β-tin to simple hexagonal transition
If the simple hexagonal phase is compressed, in experiment as well as in our simulations the complicated Cmca phase with 16 atoms per unit cell is obtained. Below, the results of a metadynamics simulation at 45 GPa are shown. A slightly increased temperature of 800 K was required to induce a sufficient distortion of the atomic positions to break the hexagonal symmetry.
(click on image to start movie)
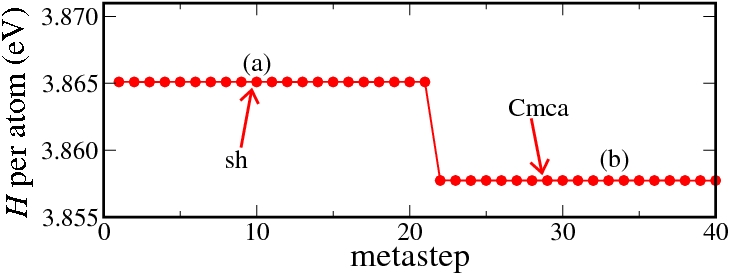
Enthalpy diagram of the simple hexagonal to Cmca transition
The results of a metadynamics simulation at 50 GPa starting from the Cmca structure are shown below. We first find two higher enthalpy levels. These correspond to simulation cells containing two different domains of the hcp phase with differing ratios, an effect which is most probably related to our finite system size of 64 atoms. Finally, in metastep 91 the defect-free hcp phase is obtained.
(click on image to start movie)
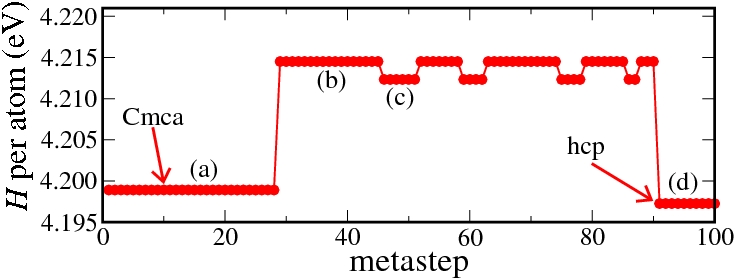
Enthalpy diagram of the Cmca to hcp transition
The transition from the hcp to the fcc phase was studied by simulations at 90 GPa. At this pressure in our DFT calculations and therefore also in the Neural Network potential the hcp phase is still the thermodynamically stable one. Nevertheless, in metastep 22 we observe the formation of the fcc phase by a shift of atomic planes.
(click on image to start movie)
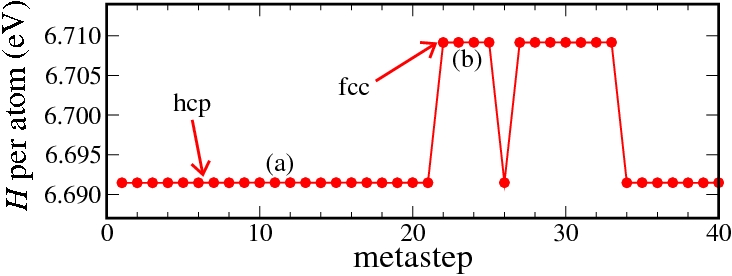
Enthalpy diagram of the hcp to fcc transition
If you are interested in further details of our simulations on Silicon please have a look at Refs. [4,7,8] and feel free to contact us. Some background on the theory of Neural Network Potentials can be found here.
| Homepage of the Behler group | |
| Theoretische Chemie, Ruhr-Universität Bochum, Germany, www.theochem.ruhr-uni-bochum.de | |
|
Impressum&Disclaimer / E-mail to the webmaster of this hompage: webmaster@theochem.ruhr-uni-bochum.de Source File: topic-prebiotic.wml (Wed Apr 9 17:01:07 2008) ($Revision: 1.2 $) Translated to HTML: Tue Jul 20 17:46:50 2010 |
|