|
Visualization and Analysis of Quantum Chemical and Molecular Dynamics Data with VMD
|
|
Careful these pages are outdated unsupported archival copies
1. Introduction

1.1. About this Tutorial
The aim of this tutorial is to help you using the
program VMD for
visualizing results from (first principles) molecular dynamics and
electronic structure calculations, mainly done with the
CPMD program, but also data from
other codes like ESPRESSO/PWScf,
GROMACS or
Gaussian that can produce
similar outputs are considered. It follows a close
hands-on approach, so you will be provided with many examples and
solutions to common problems. Most of the examples were conceived to
satisfy specific needs in the
Lehrstuhl für Theoretische Chemie at the
Ruhr-Universität Bochum, but we try to not only
show the solutions but also to describe the recipes. So we hope that
the techniques described can not only be used to solve a particular
problem, but are of more general use and can be translated to other,
similar problems. Many of the examples should be adaptable with little
effort to data created by other electronic structure or simulation
programs. To help you getting started, most of the data
and input files are available for download, so you in many cases, you
will only need to adapt and/or combine the existing solution(s).
Please note, however, that the following is assuming some background
knowledge about using VMD. If you are new to VMD, you should start
instead with the
introductory tutorial on the VMD homepage.
1.2. About the Programs
CPMD is an ab
initio electronic structure and molecular dynamics (MD) program
using a plane wave/pseudopotential implementation of density functional
theory. It is mainly targeted at Car-Parrinello MD simulations, but also
supports geometry optimizations, Born-Oppenheimer MD, path integral MD,
response functions, excited states and calculation of some electronic
properties. For further information you can take a look at the CPMD
consortium homepage at http://www.cpmd.org/.
ESPRESSO is a
collection of electronic structure codes for plane wave pseudopotential
calculations. Its main components are: PWscf (see below), FPMD and CP,
as well as a GUI for creating input files and a code to create
pseudopotentials.
PWscf
(Plane-Wave Self-Consistent Field) is a set of programs for electronic
structure calculations within Density-Functional Theory and
Density-Functional Perturbation Theory, using a Plane-Wave basis set
and pseudopotentials. PWscf is particularly well suited for the
calculation of ground state calculations for solids and surfaces.
It has support ultra-soft pseudopotentials and k-points and can
be used to calculation many properties using Density-Functional
Perturbation Theory, BOMD, and for determination of energy barriers and
reaction paths using Nudged Elastic Band (NEB) and Fourier String Method
Dynamics (SMD).
Visual Molecular Dynamics (VMD)
is a very powerful and flexible toolkit for visualization and analysis
of molecular dynamics simulation data. Although it was initially
developed with focus on large biomolecular systems, newer versions
contain many features that make it a very attractive choice for
visualizing results from CPMD and other electronic structure
calculations. Further information can be found on the VMD homepage at
http://www.ks.uiuc.edu/Research/vmd/. There also is a
VMD Script Library
with more examples of VMD scripting.
 Part 1
 Contents
 Top of Page
1.3. Notes
Most of the examples presented here assume, were tested with and may
only run with VMD version 1.8.3 or later on a UNIX(TM)/Linux machine.
 Contact axel.kohlmeyer@theochem.ruhr-uni-bochum.de
if there are compatibility problems with newer versions of VMD or on
other platforms. Any other form of feedback, e.g. corrections, enhancements,
further examples, or new visualization problems, is also highly welcome.
Contact axel.kohlmeyer@theochem.ruhr-uni-bochum.de
if there are compatibility problems with newer versions of VMD or on
other platforms. Any other form of feedback, e.g. corrections, enhancements,
further examples, or new visualization problems, is also highly welcome.
 Since the following pages mainly deal with visualization and animation
of trajectory data, they will be filled with graphics and GIF-movies
(total ~20MB). Although considerable effort has been put into reducing file
sizes and splitting the webpage into several smaller pages, you may still
consider downloading the single file PDF version
(306 kByte)
if you have a low bandwidth connection. Please note, that the conversion to
pdf sometimes has problems with the preprocessed html code, so that the
resulting pdf file here may be incomplete (everything is created from a
single source). Please notify me in that case. After switching from
html2ps
to HTMLDOC errors have been
considerably fewer, while the quality of the created pdf has improved a
lot.
Since the following pages mainly deal with visualization and animation
of trajectory data, they will be filled with graphics and GIF-movies
(total ~20MB). Although considerable effort has been put into reducing file
sizes and splitting the webpage into several smaller pages, you may still
consider downloading the single file PDF version
(306 kByte)
if you have a low bandwidth connection. Please note, that the conversion to
pdf sometimes has problems with the preprocessed html code, so that the
resulting pdf file here may be incomplete (everything is created from a
single source). Please notify me in that case. After switching from
html2ps
to HTMLDOC errors have been
considerably fewer, while the quality of the created pdf has improved a
lot.
1.4. Citation / Bookmark
If you want to cite or bookmark these pages please use the URL
http://www.theochem.ruhr-uni-bochum.de/go/cpmd-vmd.html
as the underlying link might change in the future.
1.5. Recent Changes
- 2005/01/03
- Several new examples, tricks, hacks and utilities added.
Some examples now also come with directions or inputs
for ESPRESSO/PWScf. Reviewed some of html generation macros,
added support for computed links between parts.
- 2004/07/06
- Introduced sections for the start page and
added this section, so that people know when and
where to look for new stuff. Older changes taken
from the CVS changelog.
- 2004/07/05
- PDF file generation now uses HTMLDOC instead of html2ps.
The PDF is looking much nicer now and generation is much
faster and needs less memory. Also fixed a bunch of minor
markup errors detected by htmldoc.
- 2004/05/21
- Added example for 'cloning' a representation from
one molecule to another (with an optional GUI) and
how to hook up a Tk-GUI into the extension menu.
- 2004/05/16
- Added example for calculating a 2d-Ramachandran
distribution and how to draw the result as color-coded
3d-surface using triangle drawing primitives.
Added example for a hardcopy printing command.
- 2004/05/14
- Added two new examples:
Banging two buckyballs together to illustrate the 'User'
colorization method,
and an animated Isosurface (by cycling through the volumetric
data sets) of a Hydrogen molecule shot trough Gold atoms.
Top of Page
Part 1
2. Table of Contents
1. Introduction
1.1. About this Tutorial
1.2. About the Programs
1.3. Notes
1.4. Citation / Bookmark
1.5. Recent Changes
2. Table of Contents
3. Preparation and Installation Issues
3.1. Customizing the VMD Setup
3.2. Predefining Additional Items
3.3. Extending the Script and Plugin Search Path
4. Loading and Displaying Configurations and Trajectories
4.1. Loading a Single Geometry
4.2. Creating a Visualization
4.3. Saving and Re-using a Visualization
4.4. Viewing a Trajectory
4.5. How to Show Breaking and Formation of Bonds
4.6. Adding Graphics to a Visualization
5. Adding Dynamic Graphics to a Trajectory
5.1. Adding a Progress Bar for the Elapsed Time
5.2. Display the Total Dipole Moment of the Simulation Cell
5.3. Visualizing Changing Atom Properties with Color
5.4. Modify an Atom Property Dynamically from an External File
6. Dynamic Atom Selection
6.1. Display a Changing Number of Molecules
6.2. Keeping Atoms or a Molecule in the Center and Aligned
6.3. Modify a Selection During a Trajectory
6.4. Using the User Field for Computed Selections
6.5. Tracing a Dynamic Property
7. Visualizing Volumetric Data from Cube-Files
7.1. Electron Density and Electrostatic Potential
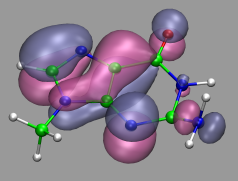
7.2. Canonical and Localized Orbitals
7.3. Electron Localization Function (ELF)
7.4. Manipulation of Cube Files / Response to an External Potential
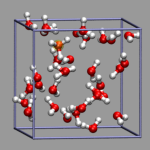
7.5. Bulk Systems
7.6. Animations with Isosurfaces
7.7. Volumetric data from Gaussian
8. Using Data Processing to Tailor Data for VMD
8.1. Visualizing Path-Integral Trajectories
8.2. Extracting the Geometry Information from old CPMD Output Files
8.3. Removing Unneeded Parts From a Cube File
8.4. Extract Some Coordinates with Bounding Box Information
8.5. Creating 3d-Ramachandran Histograms
9. Misc Tips and Tricks
9.1. Collected 'draw' Extensions
9.2. Using a Different Default Visualization
9.3. Changing the Default vdW Radii
9.4. Reloading the Current Trajectory
9.5. Visualize a Trajectory With a Changing Number of Atoms or Bonds
9.6. Set the Unit Cell Information for a Whole Trajectory
9.7. Directly Print the Current Visualization
9.8. Transferring a Visualization from a Molecule to Others
9.9. Adding a TCL-Plugin to the Extensions Menu
9.10. Turn Off Output in Analysis Scripts
9.11. Automatically Turn on TCL mode in (X)Emacs for .vmd Files
10. Credits
11. Downloads
12. Script distribution policy