Introduction
Finding out which is the best computer to run CPMD on can become a difficult task. The final result not only depends on your budget, your human resources for computer maintainance, and your personal taste but also on how well CPMD performs on different kinds of serial and parallel architectures and interconnects. This webpage is a compilation of the various CPMD benchmark results i have collected (so far) in my current function as local 'computer-guru' at the Lehrstuhl für Theoretische Chemie in Bochum.
 Contributed benchmark results, preferably with the some of the inputs
from the download section are highly welcome.
Also, if you notice any incorrect statements, debatable conclusion or
have some additional tips, that you think should appear here, please
contact me at axel.kohlmeyer@theochem.ruhr-uni-bochum.de.
Contributed benchmark results, preferably with the some of the inputs
from the download section are highly welcome.
Also, if you notice any incorrect statements, debatable conclusion or
have some additional tips, that you think should appear here, please
contact me at axel.kohlmeyer@theochem.ruhr-uni-bochum.de.
Disclaimer:
The information and files on this webpage are provided in the hope that
they will be useful but WITHOUT ANY WARRANTY; without even the implied warranty
of MERCHANTABILITY or FITNESS FOR A PARTICULAR PURPOSE.
Optimizing CPMD
In order to have some kind of fairness (benchmarks are always biased) in the results, one has to create optimized CPMD executables for the individual platforms. There are three main areas where one can improve the CPMD performance:
using an optimized BLAS / LAPACK library. Especially an optimized set of the xGEMM and xGEMV subroutines can improve the CPMD performance significantly. For some platforms vendor optimized BLAS / LAPACK libraries are available. Alternatively you can use the ATLAS library.
using an optimized FFT library. There are a number of vendor optimized FFT libraries available, some of which are supported by the current CPMD code, but the integrated fortran FFT code (-DFFT_DEFAULT) is also pretty competitive. There is a parameter, NCACHE, in the file mltfft.F which can be optimized for your platform.
using a suitable set of compiler flags. Although the Configure script will provide you with a set of optimizing compiler flags, you should better check with your compiler manual/manpage whether those are applicable for your platform. Most importantly you should set the appropriate flags for your CPU, but also - as with many floating-point intensive codes - turning on loop unrolling may improve CPMD performance. Since CPMD is already parallized, turning on auto-parallelization usually degrades performance (better compile for MPI and/or OpenMP parallelization). Also inter-procedural optimization or profile guided optimization does not seem to help a lot.
Single Processor Performance
The following timings and performance numbers are taken from Car-Parrinello MD runs of the respective systems. Compared to other CPMD calculation types (e.g. wave function optimization) CP-MD jobs use comparatively little memory, respond very well to an optimized BLAS/LAPACK library and don't need a large and fast disk.
Benchmark S1: 32 Water + 1 Formamid, PBC, 70Ryd.| Machine Description | GFLOP/s |
|---|---|
| SunFire 6800, UltraSparc-III 750MHz | 0.126 |
| IBM SP3, Power3+, 395MHz | 0.206 |
| AMD Athlon MP1600+, 1.4GHz, PC266-ECC memory | 0.356 |
| IBM SP4, Power4, 1.3GHz | 0.782 |
| NEC SX5 | 3.150 |
Discussion
This group of benchmarks demonstrates the high floating point performance of the IBM Power CPUs, but also the competitiveness of PC hardware in the price/performance. The NEC CPU is in a different league, but then again, it is a vector CPU and as such to be regarded as the equivalent of several CPUs.
Benchmark S2a: 63 Si-Atoms, PBC, 10Ryd.
| Machine Description | time [s] |
|---|---|
| AMD Athlon 650MHz, PC133 | 868 |
| AMD Athlon XP1600+, 1.4GHz, PC133 | 545 |
| AMD Athlon MP1600+, 1.4GHz, PC266-ECC | 443 |
| Compaq Alpha EV6, 500MHz, XP1000 | 435 |
| AMD Athlon MP1800+, 1.53GHz, PC266-ECC | 428 |
| AMD Athlon XP1800+, 1.53GHz, PC266 | 425 |
| HP SuperDome 32000, HPPA 8700, 750MHz | 388 |
| AMD Athlon XP2500+, 1.83GHz, PC333 | 361 |
| Compaq Alpha EV67, 677MHz, ES40 | 284 |
| AMD Opteron, 1.6GHz, PC266 memory, 32-bit | 287 |
| AMD Opteron, 1.6GHz, PC266 memory, 64-bit | 254 |
| Intel Pentium 4 Xeon, 2.4GHz, dual-channel PC200 | 236 |
| Compaq Alpha EV68AL, 833MHz, DS20 | 234 |
| Intel Itanium2, 900MHz, HP zx6000 | 206 |
| AMD Athlon64 3200+, 2.0GHz, PC333, 64-bit | 173 |
| IBM Power4+ 1.7 GHz, Regatta H+ | 171 |
Discussion (see below) Benchmark 2b: 63 Si-Atoms, PBC, 30Ryd.
| Machine Description | time [s] |
|---|---|
| AMD Athlon XP1600+, 1.4GHz, PC133 | 2878 |
| HP SuperDome 32000, HPPA 8700, 750MHz | 2672 |
| Compaq Alpha EV6, 500MHz, XP1000 | 2624 |
| AMD Athlon MP1600+, 1.4GHz, PC266-ECC | 2175 |
| AMD Athlon XP1800+, 1.53GHz, PC266 | 2136 |
| Compaq Alpha EV67, 667MHz, ES40 | 1882 |
| Compaq Alpha EV68AL, 833MHz, DS20 | 1519 |
| AMD Opteron, 1.6GHz, PC266 memory, 64-bit | 1292 |
| Intel Pentium 4 Xeon, 2.4GHz, dual-channel PC200 | 1275 |
| AMD Opteron, 1.6GHz, PC266 memory, 32-bit | 1157 |
| AMD Athlon64 3200+, 2.0GHz, PC333, 64-bit | 1148 |
| IBM Power4+ 1.7 GHz, Regatta H+ | 997 |
Discussion (see below) Benchmark 2c: 63 Si-Atoms, PBC, 50Ryd.
| Machine Description | time [s] |
|---|---|
| AMD Athlon XP1600+, 1.4GHz, PC133 | 7412 |
| Compaq Alpha EV6, 500MHz, XP1000 | 7192 |
| Compaq Alpha EV67, 677MHz, ES40 | 6456 |
| AMD Athlon XP1800+, 1.53GHz, PC266 | 5878 |
| AMD Athlon XP2500+, 1.83GHz, PC333 | 5196 |
| AMD Athlon XP2500+, 1.83GHz, dual-channel PC333 | 3848 |
| AMD Opteron, 1.6GHz, PC266 memory, 64-bit | 3632 |
| Intel Pentium 4 Xeon, 2.4GHz, dual-channel PC200 | 3401 |
| Intel Itanium2, 900MHz, HP zx6000 | 3145 |
| AMD Opteron, 1.6GHz, PC266 memory, 32-bit | 3143 |
| AMD Athlon64 3200+, 2.0GHz, PC333, 64-bit | 3134 |
| IBM Power4+ 1.7 GHz, Regatta H+ | 2259 |
Discussion
This group of benchmarks underlines, that CPMD performance (assuming a reasonably well optimized binary) is mainly influenced by two factors: floating-point performance and memory bandwidth. Lack of the latter can severly hurt the performance of an otherwise capable CPU. E.g., the two 50Ryd results of Athlon XP2500+ CPUs. The machine with a dual-channel memory interface is about a third faster. Similarly, moving from PC133 memory to PC266 memory reduces the execution time by about 25%.
The AMD Opteron machine stands out due to the fact, that it runs 32-bit code about as fast as 64-bit 'native' code. Furthermore it seems slow down less than the other CPUs when the cutoff is increased.
If you want superior single-cpu performance, the IBM Power4 CPU is the clear leader of the test sample. Also, the Itanium2 performace is impressive, given the comparatively low clock speed.
Still, PC style hardware is very competitive, and has a huge advantage, if you look at the price-performace ratio. For PC style hardware one has to make sure that the performance is not limited by lack of memory bandwidth (see also the SMP discussion).
SMP Shared Memory Overhead
On shared memory multiprocessor machines (SMP or CC-NUMA) the processes have to share some resources, also the scheduler has to coordinate the proper distribution of the jobs across the available cpus. This introduces an overhead and to quantify the SMP overhead, we run multiple serial jobs simulaneously and compare the (average) timings to a single job on the same, otherwise empty machine. The SMP speed is then percentage of the single CPU speed that is available in SMP configuration (ideally 100%, a single CPU machine would give an ideal SMP speed of 50%).
Results 63 Si-Atoms, PBC, 50Ryd (30 Ryd data if 50Ryd not available)| Machine Description | 1x time [s] | 2x time [s] | SMP speed |
|---|---|---|---|
| Dual Pentium 4 Xeon, 2.4GHz, PC200 | 1275 | 2090 | 61% |
| Dual AMD Athlon MP1800+, 1.53GHz, PC266-ECC | 2167 | 3134 | 69% |
| Dual AMD Athlon MP1600+, 1.4GHz, PC266-ECC | 2175 | 2976 | 73% |
| Dual AMD Opteron, 1.6GHz, PC266, 32-bit, 50Ryd | 3142 | 3871 | 81% |
| Dual Compaq Alpha EV68AL, 833MHz, DS20 | 1519 | 1719 | 88% |
| Dual Intel Itanium2, 900MHz, HP zx6000 | 3120 | 3507 | 89% |
| Quad Compaq Alpha EV67, 667MHz, ES40, (3x time) | 1882 | 2086 | 90% |
| AMD Opteron, 1.6GHz, PC266, 32-bit, 30Ryd | 1157 | 1183 | 98% |
| AMD Opteron, 1.6GHz, PC266, 64-bit | 3582 | 3617 | 98% |
Discussion
The dual Pentium 4 machine gives a truly abysmal SMP performance (only slighly faster than running two jobs on a single cpu machine). Also the dual Athlon timings - although not quite as bad - prove that the low memory bandwidth of current pc hardware (see also the single channel vs. dual channel timings with the Athlon XP2500+ cpu) is badly hurting the SMP performance. The comparison of the Athlon MP1800+ and MP1600+ times underlines, that for dual cpu operation the memory bandwidth of the PC266 memory is already fully exhausted with the MP1600+ CPU.
The Itanium and Alpha CPU machines give the typical performance of most workstation class SMP machines. The close to optimal timing on the Opteron machines document the advantage of integrating a capable memory controller into the CPU. It will be interesting to see, how this scales to 4-way and 8-way machines. But there seems to be a problem, if one is using too much memory for a 32-bit job.
Parallel Performance
The following timings and performance numbers are taken from parallel Car-Parrinello MD runs of the respective systems. The characteristics of the jobs are described at their corresponding serial counterparts.
All benchmarks graphs as provided as downloadable PDF files for printing and closer inspection. Also you can download the Grace Project Data Files if you want to add your own benchmark data. You have to use the Program Grace for plotting them.
Benchmark P1: 32 Water + 1 Formamid, PBC, 70Ryd.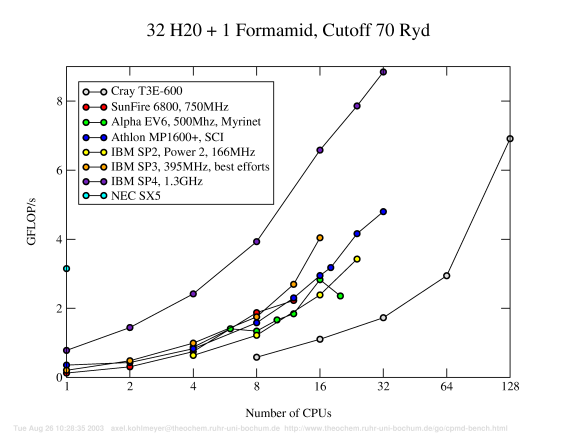
Discussion
The parallel benchmark results above demonstrate the extremely high performance of the Power4 CPUs for floating point intensive applications and the good scalability up 16 CPUs (i.e. up to using one full frame). The very good scalability result for the IBM SP3 has to be offset by the fact, that for these 'best effort' results not all CPUs in the nodes were used. Using all of them would reduce the performance significantly. Note the very good scalability of the Cray T3E. Despite the age of that architecture, one can still get a very good performance (if one gets to use a lot of CPUs). Other architectures like the Athlon-SCI machine already suffer from the parallelization limitations of CPMD much earlier.
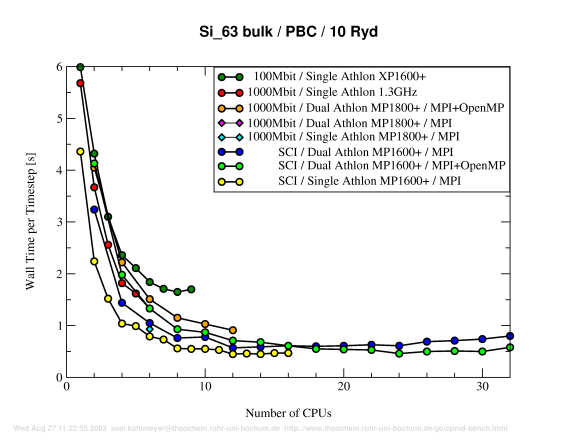
Benchmark P2a: 63 Silicon, PBC, 10Ryd.
Discussion (see below)
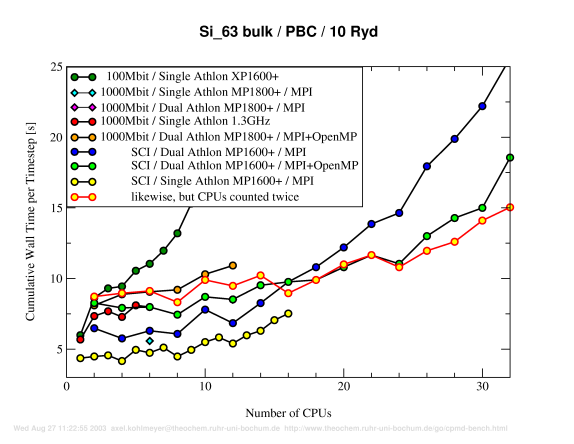
Discussion
Despite the small size of this example, there still is a large performance gain in running the the job in parallel, even with a 100Mbit TCP/IP interconnect. The absolut fastest times were about 45 seconds for the full md job, which is about four times faster than the fastest CPU in the corresponding single CPU benchmark. The intrinsic scalability limit of the MPI parallelization of CPMD seems to be reached with 12 MPI nodes. The low thoughput/high latency of the 100Mbit TCP/IP interconnect imposes such a high perfomance hit, that already beyond 4 nodes the scalability is severely reduced and the speed decreases at 9 nodes. With gigabit ethernet the performance and scalability is much better, but with the SCI high-speed interconnect one gains another 30% speed increase (with a 8% slower CPU!).
The blue and bright green graphs demonstrate that a combined MPI plus OpenMP parallelization is faster than a sole MPI parallelization, if the intrinsic scalability limit of the distributed memory strategy of CPMD is reached. In this example the crossover point is reached at 8 nodes (16 CPUs). With less CPUs a sole MPI job is faster, due to the more complete MPI parallelization in CPMD. The absolute best performance is reached with not using the second CPU on the dual machines at all. To understand that result, one has to factor in, that for OpenMP parallelizion, one (of the very few) registers is lost, there is an overhead for thread creation and finally in dual-athlon configuration one gets only about about 75% of the single CPU performance. The yellow graph with the red outline lists the single CPU performance as if the second CPU was used and one can see that there is no area, where using an MPI/OpenMP executable has a significant advantage. This will be much different on machines with a smaller SMP overhead, but unfortunately there has not been a chance to run this benchmark on such a machine.
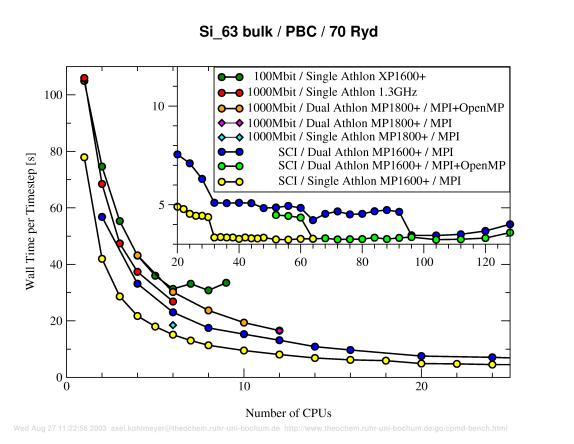
Benchmark P2d:
63 Silicon, PBC, 70Ryd.
Discussion (see below)
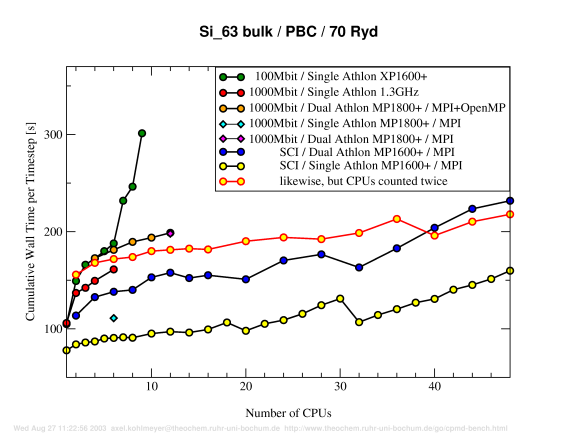
Discussion
The parallel benchmark results presented here again prove the excellent scalability of the SCI interconnect technonolgy (see also the HP-Linpack benchmark results elsewhere on this homepage). Since both Si 63 examples are comparatively small, the intrinsic scalability limitations of the CPMD parallelization strategy become visible. But with a larger cutoff the limit is reached with a larger number of nodes, e.g. 6 nodes instead of 4 nodes for 100Mbit or 48 nodes instead of 12 nodes for SCI. Otherwise the results (and conclusions) are very much the same than for the 10 Ryd runs.
Download Input Files
The following gzipped tar archives or zip archives are the inputs, pseudopotential files and one reference output for the various benchmark calculations on this page. Please keep in mind, that these jobs are not meant to be good examples of CPMD calculations. In fact, some of them are pretty pointless. Their sole purpose is to get a reasonable estimate of the CPMD performance.
| 32 Water + 1 Formamid, PBC, 70Ryd |
32h2o.tar.gz | 32h2o.zip |
| 63 Water + 1 Hydrogen, PBC, 70Ryd, ELF |
63h2o.tar.gz | 63h2o.zip |
| 63 Si + PBC, 10Ryd |
|
|
| 63 Si + PBC, 30Ryd |
|
|
| 63 Si + PBC, 50Ryd |
|
|
| 63 Si + PBC, 70Ryd |
|
|
| 63 Si + PBC, 120Ryd |
|
|
Contributers To This Page
The following people and institutions (in no specific order) helped me a lot to build this page by providing me with benchmark data, input examples, giving me access to their machines or donating hardware. Thanks guys.
- AMD Germany, Stefan Seyfried
- Amalendu Chandra
- Nikos Doltsinis
- Jürg Hutter
- Barbara Kirchner
- Holger Langer
- Dominik Marx
- Rochus Schmid
- John Stubbs
- KIZ Ulm, Thomas Nau
- ZAM Jülich, Ulrich Detert
- ALiCE Wuppertal, Norbert Eicker
- HPC@RRZ Erlangen, Georg Hager
Disclaimer / Author of this page: Axel.Kohlmeyer@theochem.ruhr-uni-bochum.de
Source File: cpmd-bench.wml (Wed Jan 5 15:02:01 2005) ($Revision: 1.15 $) Translated to HTML: Mon Oct 10 00:07:30 2005