|
|
|
|
Visualization and Analysis of Quantum Chemical and Molecular Dynamics Data with VMD Part 7 |
|
9. Misc Tips and Tricks
![]()
9.1. Collected 'draw' Extensions
![]()
9.2. Using a Different Default Visualization
![]()
9.3. Changing the Default vdW Radii
![]()
9.4. Reloading the Current Trajectory
![]()
9.5. Visualize a Trajectory With a Changing Number of Atoms or Bonds
![]()
9.6. Set the Unit Cell Information for a Whole Trajectory
![]()
9.7. Directly Print the Current Visualization
![]()
9.8. Transferring a Visualization from a Molecule to Others
![]()
9.9. Adding a TCL-Plugin to the Extensions Menu
![]()
9.10. Turn Off Output in Analysis Scripts
![]()
9.11. Automatically Turn on TCL mode in (X)Emacs for .vmd Files
![]()
![]() Part 6
Part 6
![]() Part 8
Part 8
![]() Start
Start
![]() Contents
Contents
This chapter is a collection of (hopefully) useful odds and ends that came up while working on these pages and with VMD in general.
 The following is a collection of extensions to the
draw command. All of them return a list of graphics ids for
the graphics primitives they were build of. When stored in
a variable, they can be selectively deleted like in the following
example (a more elaborate version is availiable for download as
test-draw-ext.vmd):
The following is a collection of extensions to the
draw command. All of them return a list of graphics ids for
the graphics primitives they were build of. When stored in
a variable, they can be selectively deleted like in the following
example (a more elaborate version is availiable for download as
test-draw-ext.vmd):
# draw one blue prism and a red vector on top of it
set gidlist [draw prism {-0.7 -0.5 0.0} {0.7 -0.5 0.0} {0.0 1.0 0.0}]
draw color red
append gidlist " " [draw vector2 {0.0 0.0 0.0} {0.0 0.0 2.0} 1.0 20]

# draw a green sphere
draw color green
set sphere [draw sphere {0.0 0.0 -2.0} radius 2.0 resolution 30]

# delete only the sphere.
draw delete $sphere
|
The individual extensions are:
| cell | (vmd|auto|{a b c alpha beta gamma}), default:"vmd" "vmd" will use the internal values "auto" will build a orthogonal unitcell based on 'measure minmax {all}' else a list of a,b,c,alpha,beta,gamma will be assumed. |
| origin | ({x y z}|auto) default: {0.0 0.0 0.0} or "auto" with "cell auto" |
| style | (lines|dashed|rod) default: line |
| width | 'width' of the lines/rods, default: 1.0 |
| resolution | resolution of cylinders/spheres for 'style rod',default: 8 |
Sometimes one would want to have VMD start with a different default visualization. While this is not directly supported, something very similar can be achieved by tracing either the vmd_initialize_structure or the vmd_trajectory_read variable, which will be triggered when the loading of a new molecule starts or when it is finished, respectively. The following example code, when placed into your .vmdrc file, will add a new representation as defined in the my_def_viz procedure to the newly loaded molecule:
# delete the default visualization and create another one
proc my_def_viz {args} {
   lassign $args fname molid
   mol delrep 0 $molid
   mol color Type
   mol representation CPK 1.000000 0.300000 19.000000 16.000000
   mol addrep $molid
}

# add 'default visualization' hack for the first three molecules.
trace variable vmd_read_trajectory(0) w my_def_viz
trace variable vmd_read_trajectory(1) w my_def_viz
trace variable vmd_read_trajectory(2) w my_def_viz
|
Note that this 'hack' does not work for molecules loaded from the commandline as they are loaded, before .vmdrc is processed. Also, in case of vmd_init_structure the default visualization (Lines) will still be added to the molecule, as it will be added after my_def_viz has been processed so that there is no chance to delete there. In the case of vmd_read_trajectory the new visualization will be created after the whole file has been read, which may not be what you want, if you want to see the new visualization alread during the loading of the trajectory.
WARNING:Visualizations other then Line can put a severe strain on your available graphics and memory resources when loading very large molecules or structures.
VMD does not know the van der Walls radii for many atom types. Since there are not too many of them in biomolecules, it is usually not a big problem. Also the radius can be changed via the script interface so you can change it later, anyways. If you are not working on/with biomolecules, that can become somewhat cumbersome, to always have to reset the values to what you want, so one may want to change the defaults. Using (almost) the same method as in the previous example this can be done on loading a new structure. The following example code, when placed into your .vmdrc file, will reset the vdW radii for the first three molecules to the values in the table. The entry on the left is a string handed to atomselect and the entry on the right is the corresponding radius. Please note, that the less specific selections have to come first, so they do not override the more specific ones. Of course this is not restricted to atom names: you can use any selection string you like.
# example to change the default VDW radii
# function to apply the radii on loading a structure
proc my_set_def_vdw {args} {
  lassign $args fname molid
# define list of selections and matching radii
  set my_def_vdw {
    {name H }  { 1.0 }  {name C }  { 1.5 }  {name N }  { 1.4 }  {name O }  { 1.3 }  {name F }  { 1.2 }  {name P }  { 2.0 }  {name S }  { 1.9 }  {name Cl}  { 2.5 }  }
  foreach {selstr rad} $my_def_vdw {
     set my_sel [atomselect $molid "$selstr"]
     $my_sel set radius $rad
     $my_sel delete
  }
}
# hook up the function.
trace variable vmd_initialize_structure(0) w my_set_def_vdw
trace variable vmd_initialize_structure(1) w my_set_def_vdw
trace variable vmd_initialize_structure(2) w my_set_def_vdw
|
When monitoring a running simulation, you may want to update the coordinates from the currently written file without having to recreate the visualization or exiting VMD. The following reload procedure (reload.tcl) will delete all frames and then reload the last coordinate file for the current top molecule preserving the current visualization and its orientation and scaling. reload also supports the waitfor option of the mol load command.
proc reload {args} {
    lassign $args arg1 arg2

    set viewpoints {}
    set mol [molinfo top]

    # save orientation and zoom parameters
    set viewpoints [molinfo $mol get {
        center_matrix rotate_matrix scale_matrix global_matrix}]

    # delete all frames and (re)load the latest data set.
    animate delete all
    set files [lindex [molinfo $mol get filename] 0]
    set lf [expr [llength $files] - 1]

    if {$arg1 == "waitfor"} {
        mol addfile [lindex $files $lf] \
            type [lindex [lindex [molinfo $mol get filetype] 0] $lf] \
            $arg1 $arg2
    } else {
        mol addfile [lindex $files $lf] \
            type [lindex [lindex [molinfo $mol get filetype] 0] $lf]
    }

    # restore orientation and zoom
    molinfo $mol set {center_matrix rotate_matrix \
                      scale_matrix global_matrix} $viewpoints
}
|
As already stated in the introduction to the visualization of trajectories , the internal design of VMD does not allow for changes of bonds and number of atoms during a trajectory. In case of breaking bonds, this can be handled most of the time by using the Dynamic Bonds representation. But if you want to have a changing number of atoms or display only specific bonds (e.g. as given in specific psf files), then one needs some extra scripting magic, to make this work with VMD. For example one can load each individual frame as a separate molecule and then define a new procedure molmovie (molmovie.tcl) to turn on only one of them sequentially and thus create an animation.
|
| |||
|
The upper example are just some frames of the zundel ion movie from the beginning of the tutorial (zundel-frames.tar.gz), the lower example is more elaborate and from a simulation, where the crossing of the periodic boundaries of long molecules requires new connectivity information in each step after wrapping all atom positions back into the unitcell (psf-molmovie-example.vmd). To get a uniform visualization for all frames, it utilizes the clone_reps command. The data for this example is also available: psf-molmovie-example.tar.gz (1 MByte).
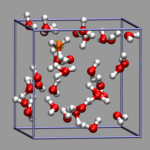
Some coordinate file formats (e.g. trr, xtc, some versions of dcd, pdb, cube, or xsf) contain information about the shape and dimensions of the current unit cell. If this is not available or VMD does not support reading the unit cell information for a given file, it is required to set this manually if display of periodic images is desired. For a trajectory, this can become quite tedious, as the unit cell information needs to be set for every frame. The following set_unitcell procedure (set_unitcell.tcl) will make this more convenient for simulations with fixed cell dimensions.
proc set_unitcell {a b c {molid top} {alpha 90.0} {beta 90.0} {gamma 90.0}} {

    if {![string compare $molid top]} {
        set molid [molinfo top]
    }

    set n   [molinfo $molid get numframes]
    for {set i 0} {$i < $n} {incr i} {
        molinfo $molid set frame $i
        molinfo $molid set {a b c alpha beta gamma} \
            [list $a $b $c $alpha $beta $gamma]
    }
}
|
VMD does not have an internal Print This Now facility, but it can be easily implemented using the integrated rendering capabilites the following is just a rough example which can probably rather easily expanded into a print dialog plugin.
proc hardcopy { {printer "ps"} {renderer "TachyonInternal"}} {

# set the background temporarily to white to save ink and money.
    set oldbg [colorinfo category Display Background]
    color Display Background white

# temporary files
    set tga {/tmp/.hardcopy.tga}
    set ps  {/tmp/.hardcopy.ps}

    render $renderer $tga
    exec convert $tga $ps
    exec lpr -P$printer $ps
    exec rm -f $tga $ps

# reset background color
    color Display Background $oldbg
}
|
After sourcing or (auto-)loading this procedure you only have to type hardcopy to print the current visualization. The first argument selects the printer (default is 'ps') and the second the renderer (for this simple script only 'snapshot' and 'TachyonInternal' work). Note: this procedure assumes that you are running on a Unix-like operating system and have the ImageMagick tools installed. A file with this subroutine, hardcopy.tcl, is also available for download.
If you have several molecules loaded, you sometimes want to re-use the same (elaborate) visualization that you have created for one molecule for the other molecules. This can be achieved by deleting the current list of representations and then read out and apply the representations from another molecule using the mechanism also used by the 'Save State' functionality. This can be easily put into a tcl procedure. The file clone_reps.tcl provides a new command clone_reps which takes the two the molecule ids as arguments. So "cloning" the visualization from molecule 0 to molecules 2 and 3 becomes:
clone_reps 0 2 clone_reps 0 3 |
This can also be easily called from a small Tk/TCL GUI (clonerepgui.tcl), which can be registered to the extensions menu. See the next section on how to create and use it.
 VMD does not only include the TCL-interpreter, but also the Tk-GUI-library
which can be used to create graphical user interfaces for your
scripts. In this example a small GUI frontend to the
clone_reps.tcl script shall be added to VMD's extensions
menu.
VMD does not only include the TCL-interpreter, but also the Tk-GUI-library
which can be used to create graphical user interfaces for your
scripts. In this example a small GUI frontend to the
clone_reps.tcl script shall be added to VMD's extensions
menu.
We start by creating a namespace, defining per-namespace global variables, and providing a package name and version. In this case we need to share access to the base widget of the gui and the two molecule ids.
package provide clonerepgui 1.0

namespace eval ::CloneRep:: {
    namespace export clonerepgui

    variable w;                # handle to the base widget.

    variable fromid  "0";      # molid of the molecule to grab
    variable toid    "1";      # molid to clone the representations to

}
|
Now we need to provide a procedure ::CloneRep::clonerepgui that will create the GUI and a few callback functions for the active elements of the GUI (e.g. the buttons). Since this should not become a general Tk/TCL tutorial, we will concentrate on one small example (see the comments in the script file clonerepgui.tcl for some more info): the callback for the Clone button. We import the two global variables with the molecule ids and then call the clone_reps procedure explained above.
proc ::CloneRep::CloneRepDoClone { args } {
    variable fromid
    variable toid

    clone_reps $fromid $toid
}
|
Since we want to register the GUI in the Extensions menu, we also have to provide a callback function, that will create the GUI and return a handle to the main widget.
proc clonerepgui_tk_cb {} {
  ::CloneRep::clonerepgui
  return $::CloneRep::w
}
|
To finally register the plugin with the main VMD GUI, we have to put the following code into our .vmdrc file.
if { [catch "package require clonerepgui" msg] } {
  puts "CloneRep plugin could not be found:\n$msg"
} elseif { [catch {menu tk register clonerepgui clonerepgui_tk_cb} msg] } {
  puts "CloneRep plugin could not be registered:\n$msg"
} else {
  puts "CloneRep activated"
}
|
As usual the files clone_reps.tcl and clonerepgui.tcl are available for download.
Tcl commands run from the VMD command prompt send their return values also to the standard output (i.e. the screen). This can be annoying if not impeding the execution speed when running large analysis scripts. Simply closing stdout does not work in this case (you'll probably get a segmentation fault or worse), but since interative processing is disabled for subroutines, you can execute it from a subroutine. So instead of running vmd -dispdev text -e get-his.vmd which would produce the following output.
Info) Using plugin gro for structure file AChE.gro
Info) Using plugin gro for coordinates from file AChE.gro
Info) Determining bond structure from distance search ...
Info) Finished with coordinate file AChE.gro.
Info) Analyzing structure ...
Info)    Atoms: 43518
Info)    Residues: 12237
Info)    Waters: 11700
Info)    Segments: 1
Info)    Fragments: 11701   Protein: 1   Nucleic: 0
0
atomselect0
{41.4300003052 37.7299995422 43.4099998474} {45.8900032043 42.5899963379 48.6999969482}
4.46000289917 4.85999679565 5.28999710083
6.46000289917 6.85999679565 7.28999710083
Info) VMD for LINUX, version 1.8.2 (December 4, 2003)
Info) Exiting normally.
|
You can get rid of the unwanted red part, i.e. the return values, by executing a small wrapper script instead (source_silent.tcl):
# define subroutine
proc source_silent {args} {
    foreach f $args {
        source $f
    }
}

# execute the original script
source_silent {get-his.vmd}
|
To have (X)Emacs recognize .vmd files as tcl code you have to add the following code to your ~/.emacs file:
(setq auto-mode-alist
  (append '(("\\.vmd$"  . tcl-mode)) auto-mode-alist))
|
Full Table of Contents
![]()
1. Introduction
1.1. About this Tutorial
1.2. About the Programs
1.3. Notes
1.4. Citation / Bookmark
1.5. Recent Changes
2. Table of Contents
3. Preparation and Installation Issues
3.1. Customizing the VMD Setup
3.2. Predefining Additional Items
3.3. Extending the Script and Plugin Search Path
4. Loading and Displaying Configurations and Trajectories
4.1. Loading a Single Geometry
4.2. Creating a Visualization
4.3. Saving and Re-using a Visualization
4.4. Viewing a Trajectory
4.5. How to Show Breaking and Formation of Bonds
4.6. Adding Graphics to a Visualization
5. Adding Dynamic Graphics to a Trajectory
5.1. Adding a Progress Bar for the Elapsed Time
5.2. Display the Total Dipole Moment of the Simulation Cell
5.3. Visualizing Changing Atom Properties with Color
5.4. Modify an Atom Property Dynamically from an External File
6. Dynamic Atom Selection
6.1. Display a Changing Number of Molecules
6.2. Keeping Atoms or a Molecule in the Center and Aligned
6.3. Modify a Selection During a Trajectory
6.4. Using the User Field for Computed Selections
6.5. Tracing a Dynamic Property
7. Visualizing Volumetric Data from Cube-Files
7.1. Electron Density and Electrostatic Potential
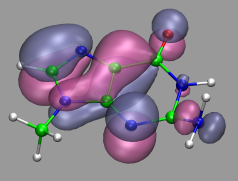
7.2. Canonical and Localized Orbitals
7.3. Electron Localization Function (ELF)
7.4. Manipulation of Cube Files / Response to an External Potential
7.5. Bulk Systems
7.6. Animations with Isosurfaces
7.7. Volumetric data from Gaussian
8. Using Data Processing to Tailor Data for VMD
8.1. Visualizing Path-Integral Trajectories
8.2. Extracting the Geometry Information from old CPMD Output Files
8.3. Removing Unneeded Parts From a Cube File
8.4. Extract Some Coordinates with Bounding Box Information
8.5. Creating 3d-Ramachandran Histograms
9. Misc Tips and Tricks
9.1. Collected 'draw' Extensions
9.2. Using a Different Default Visualization
9.3. Changing the Default vdW Radii
9.4. Reloading the Current Trajectory
9.5. Visualize a Trajectory With a Changing Number of Atoms or Bonds
9.6. Set the Unit Cell Information for a Whole Trajectory
9.7. Directly Print the Current Visualization
9.8. Transferring a Visualization from a Molecule to Others
9.9. Adding a TCL-Plugin to the Extensions Menu
9.10. Turn Off Output in Analysis Scripts
9.11. Automatically Turn on TCL mode in (X)Emacs for .vmd Files
10. Credits
11. Downloads
12. Script distribution policy
|
|
|
||
|
|||